Modulation Transfer Function (MTF)
Diffraction limit - Airy disk
The Airy disk is description of the best focused spot of light that a perfect lens with a circular aperture can make, limited by the diffraction of light.
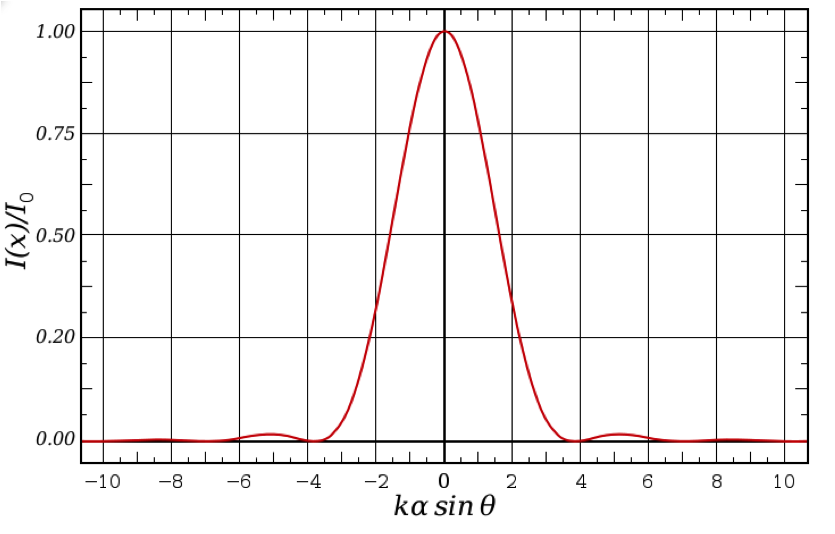
When light passes through any size aperture (every lens has a finite aperture), diffraction occurs. The resulting diffraction pattern, a bright region in the center together with a series of concentric rings of decreasing intensity around it, is called the Airy Disk
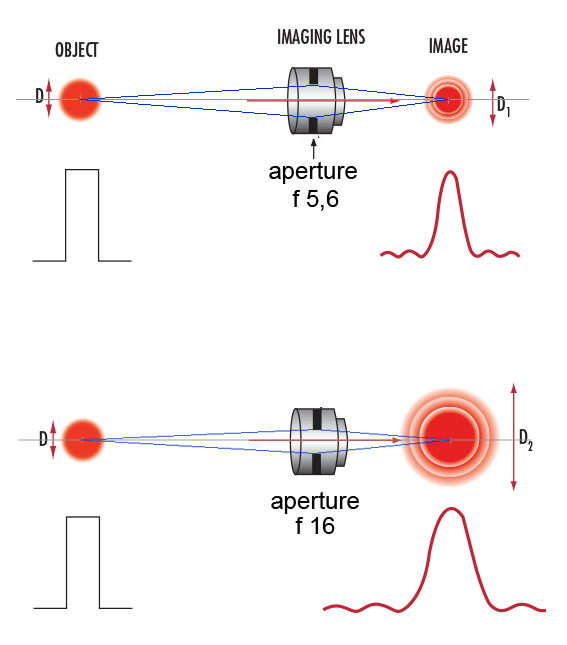
The diameter of this pattern is related to the wavelength (λ) of the illuminating light and the size of the circular aperture, which is important since the Airy Disk is the smallest point to which a beam of light can be focused. As focused Airy patterns from different details on the object come close together, they begin to overlap . When the overlapping patterns create enough constructive interference to reduce contrast, they eventually become indistinguishable from each other. Image shows the difference in spot sizes between a lens set at f/5.6 and a lens set at f/16.
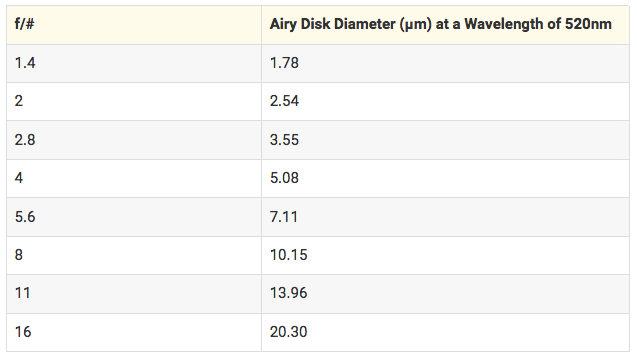
As pixels continue to reduce in size, this effect becomes more of an issue and eventually is very difficult to overcome. The Airy Disk, or minimum spot size can be calculated using the f/# and wavelength in μm:

Table shows the calculated Airy Disk diameter for different f/#s using green light (520nm). The smallest achievable spot size can quickly exceed the size of small pixels. This leads to difficulties when trying to yield the full resolution capacities of a sensor with any usable level of contrast. Additionally, this does not take into account any lens design limitations and manufacturing errors associated with the fabrication of lens elements and optical assemblies, which can lead to reductions in the ability to produce the smallest physically achievable spot and thus reduced levels of resolution and contrast.
Note: This is all theoretical and is the starting point for limitations in an optical system.
MTF chart
The sharpness of a photographic imaging system or of a component of the system (lens, film, image sensor, scanner, enlarging lens, etc.) is characterized by a parameter called Modulation Transfer Function (MTF), also known as spatial frequency response.
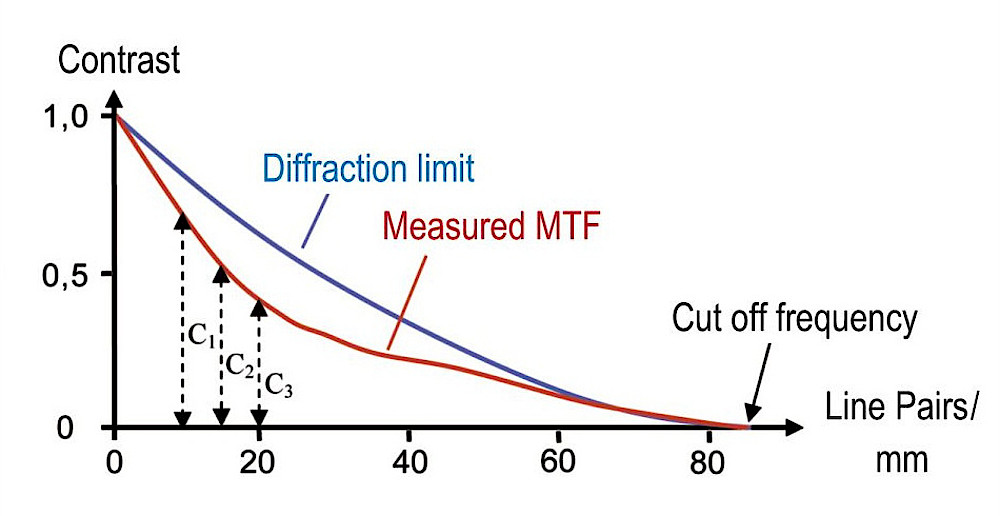
MTF is the spatial frequency response of an imaging system or a component; it is the contrast at a given spatial frequency relative to low frequencies.
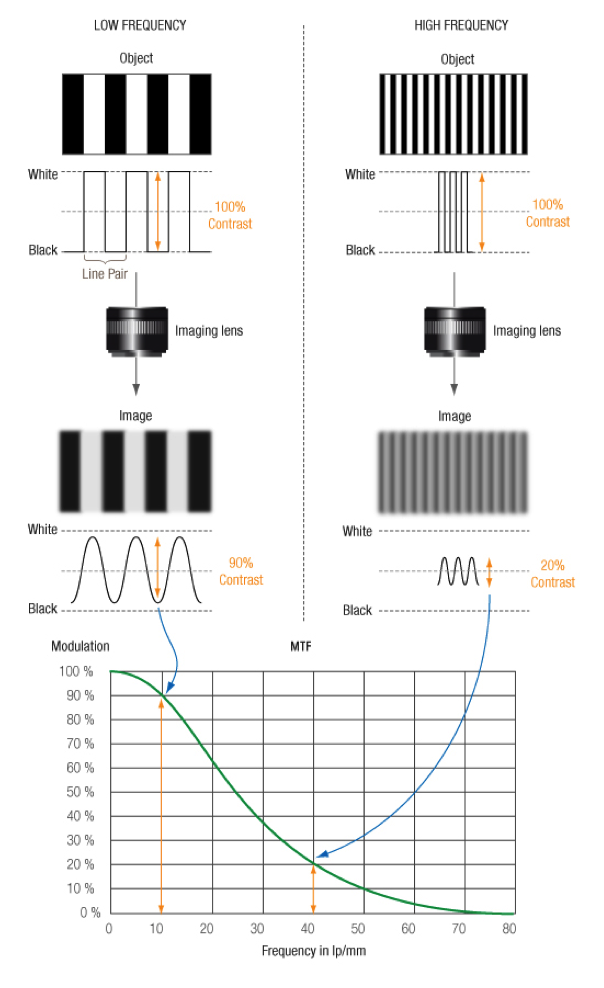
Spatial frequency is typically measured in cycles or line pairs per millimeter (lp/mm), which is analogous to cycles per second (Hertz) in audio systems. Lp/mm is most appropriate for film cameras, where formats are relatively fixed (i.e., 35mm full frame = 24x36mm), but cycles/pixel (c/p) or line widths per picture height (LW/PH) may be more appropriate for digital cameras, which have a wide variety of sensor sizes.
High spatial frequencies correspond to fine image detail. The more extended the response, the finer the detail— the sharper the image.
How to read MTF charts
A MTF chart plots the contrast and resolution of a lens from the center to its edges against a "perfect" lens that would have 100% contrast. The contrast of a lens is important as this works in correlation to lens resolution.
Using a MTF chart is the preferred method for studying lens optical performance as they use theoretical equations to plot a performance graph and don't rely on subjective opinion, subject matter, camera features, software or other factors.
The y-axis (vertical axis) of a MTF chart plots the transmission of light (contrast) through the lens with a maximum value of "1.0" which would indicate 100% transmittance (contrast) of the light, although 100% transmittance of light is not possible because glass is not 100% transparent.
The x-axis (horizontal axis) shows the distance from the center of the image towards its edges. So, the "0" in the lower left corner represents the center of the lens and the numbers along the lower axis represent the distance out towards the edge of the lens in millimeters.
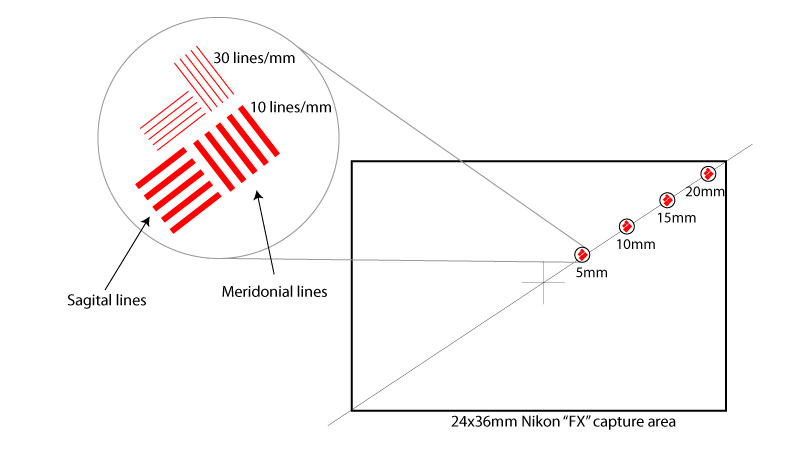
here are two groups of data plotted on a MTF chart: Sagital and Meridonial lines.
"Sagital lines" (the solid lines) represent the contrast measurements of pairs of lines that run parallel to a central diagonal line that passes through the middle of the lens from the bottom left hand corner to the top right hand corner.
"Meridonial lines" (the dotted lines) represent line pairs also positioned along an imaginary line from the center of a lens to the edge but these line pairs are perpendicular to the diagonal line.
There are two groups of test lines for each Sagital and Meridonial value: one group or line pairs at 10 lines per millimeter and a second group at 30 lines per millimeter. The lower line pairs (10 lines/mm) will generally be plotted higher on the graph than the more challenging fine resolution 30 lines/mm.
In general, the higher and flatter the lines the better. Higher lines indicate better contrast (10 lines/mm) or resolution (30 lines/mm) while a flatter (left to right) line shows that the optical performance is close to the same at the edge of the image compared to the center.
Below is a MTF chart for the AF-S DX NIKKOR 35mm f/1.8G lens. When measuring a lens' performance for a MTF chart, Nikon tests are carried out with the lens at its maximum (widest) aperture. The contrast of the Sagital and Meridonial line pairs at various points from the lens' center are read and plotted on the chart.
The MTF chart consists of measurement for the Sagital and Meridonial lines at both 10 lines per millimeter and 30 lines per millimeter. This produces a chart with 4 separate lines.
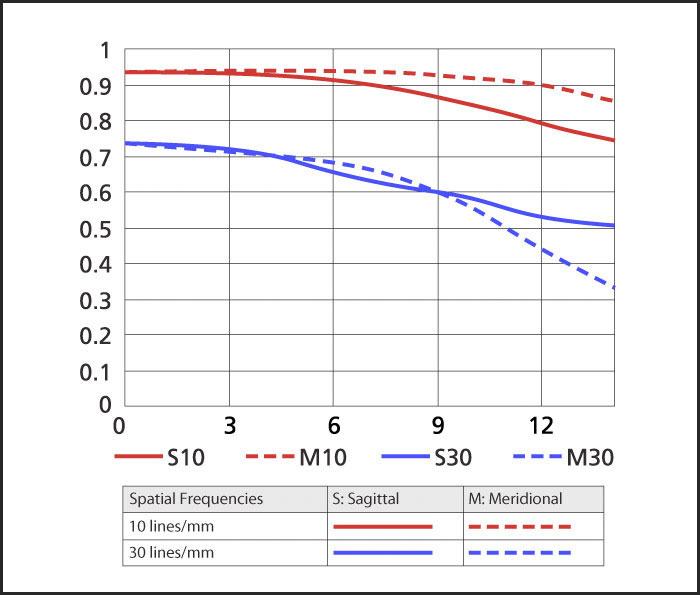
The red 10 line/mm (10 lines per millimeter) indicates the lens' ability to reproduce low spatial frequency or low resolution. This line indicates the lens' contrast values and the higher and straighter this line is the better; because the higher the line appears the greater the amount of contrast the lens can reproduce.
The blue 30 line/mm (30 lines per millimeter) indicates the lens' ability to to reproduce higher spatial frequency or higher resolution; this line relates to the resolving power of the lens and again the higher the line the better.
The line starts on the left of the chart which represents the center of the lens. As the line moves to the right it indicates the edge of the lens, so you can see how the contrast and sharpness of the lens decreases from the center to the edge of the image.
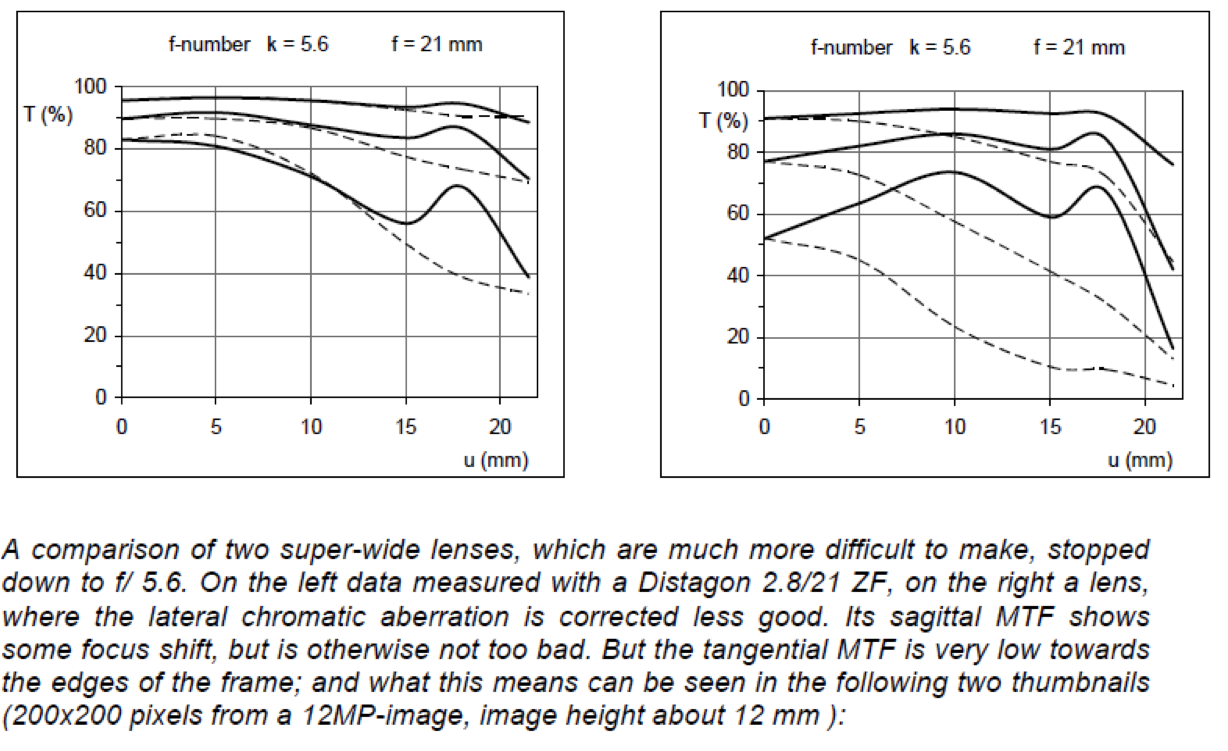
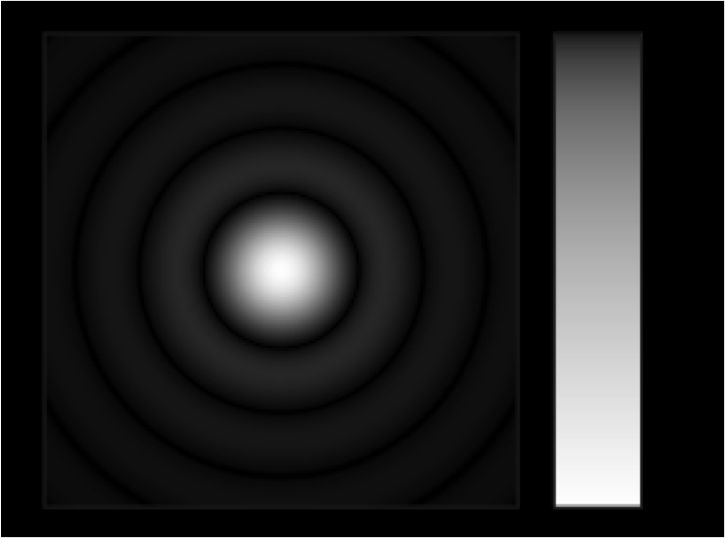
The comparison of two lenses